Performance comparison with nav2_amcl
Environment details
CPU: Intel(R) Core(TM) i7-10750H CPU @ 2.60GHz x 6 cores x 2 threads/core
RAM: 16384 MB
Host OS: Ubuntu 22.04.2 LTS
Commit hash: 640c23dd654bd604493d7c98b28625269b123b21
Experimental setup
The following configuration was used during the experiments:
The benchmarks were run using 250, 300, 400, 500, 750, 1000, 2000, 5000, 10000, 20000, 50000, 100000 and 200000 particles.
beluga_amclwas run both using multithreaded and non-multithreaded configurations.nav2_amclonly provides non-multithreaded execution.Both the
beam sensorand thelikelihood fieldsensor model were tested.The bagfile containing the synthetic dataset was replayed at 3x speed.
More specific configuration details can be found in the params.yaml files:
nav2_amcl(likelihood field) uses likelihood_params.yamlbeluga_amcl(likelihood field, non-multithreaded) uses likelihood_params.yamlbeluga_amcl(likelihood field, multithreaded) uses likelihood_params_par.yamlnav2_amcl(beam) uses beam_params.yamlbeluga_amcl(beam, non-multithreaded) uses beam_params.yamlbeluga_amcl(beam, multithreaded) uses beam_params_par.yaml
Except for the multithreading and sensor model parameters, the configuration on all of the files is identical.
Recorded metrics
The following metrics were recorded during each run:
RSS (Resident Set Size), amount of memory occupied by a process that is held in RAM.
CPU usage.
APE (Absolute Pose Error) statistics:
mean,median,maxandrmse.
Results
Non-multithreaded Beluga vs. Nav2 AMCL with Likelihood Field Sensor Model
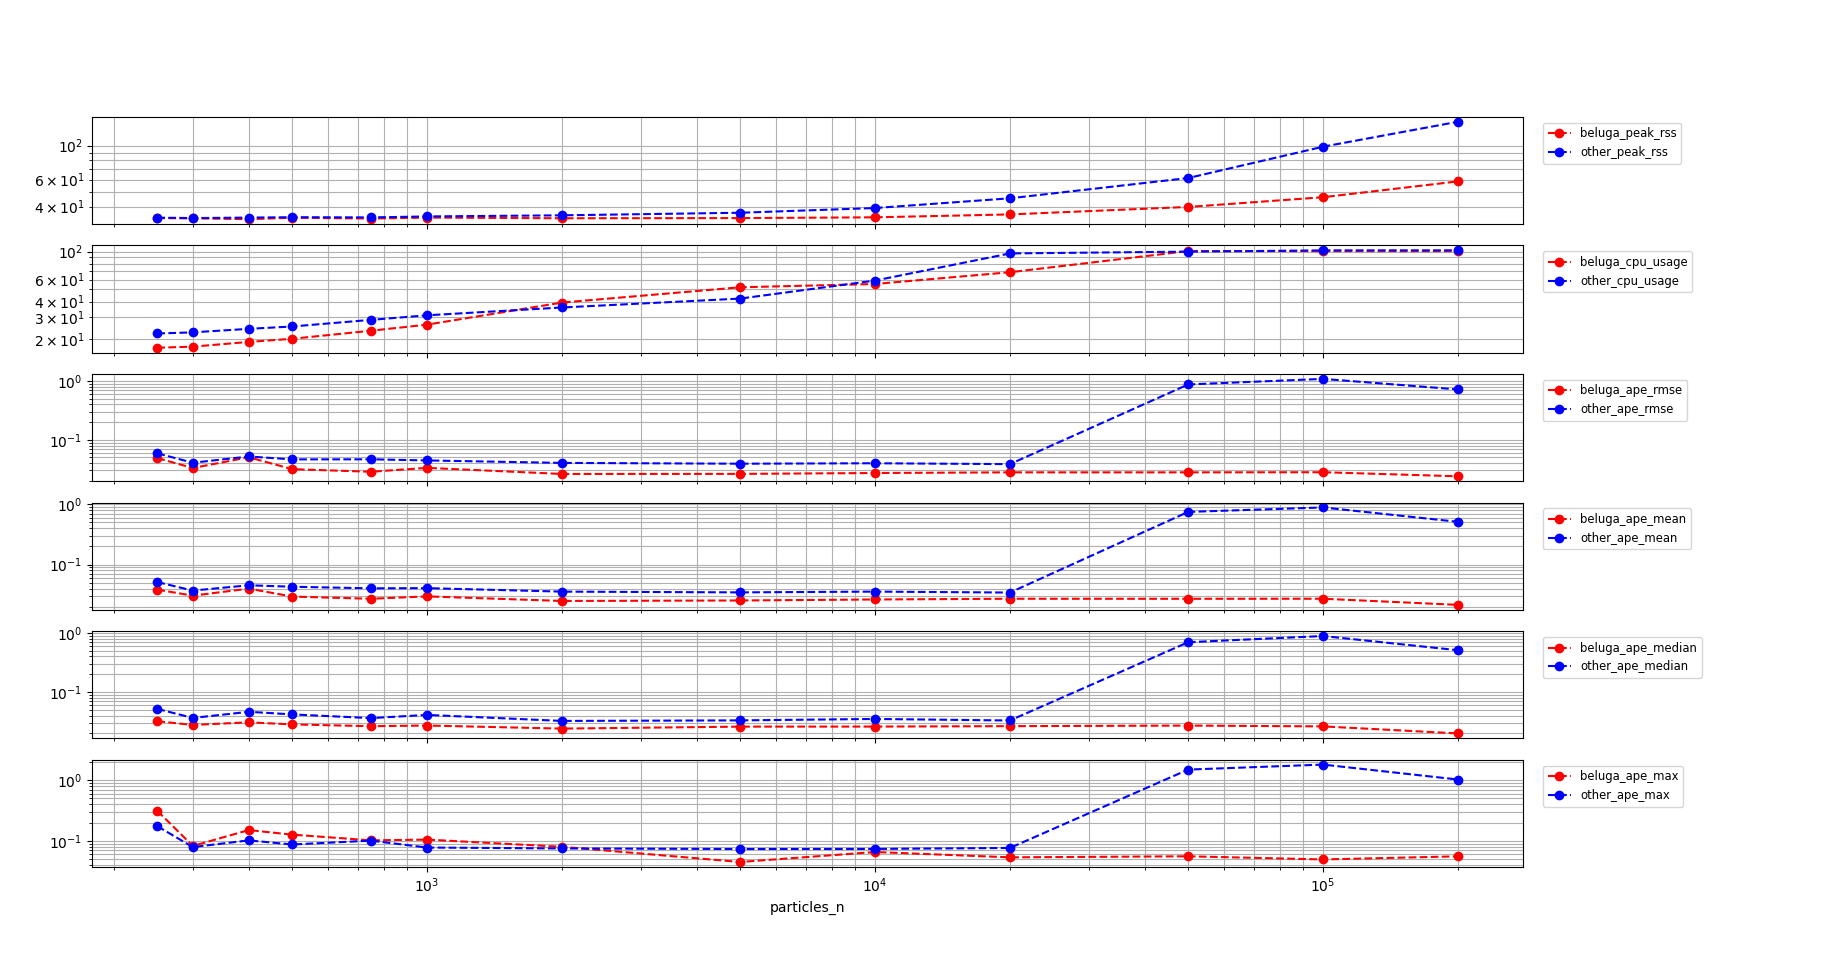
Commentary on the results:
Memory usage for
beluga_amclgrows slower than fornav2_amclthroughout the whole range of particle counts.beluga_amclhas about the same level of CPU usage asnav2_amclunder $10^4$ particles. Beyond that point both non-multithreaded implementations saturate near 100% CPU usage.The trajectory APE is on par or slightly better for
beluga_amclthannav2_amclthroughout the whole range of particles. In the CPU saturation region, the localization performance fornav2_amclsuddenly degrades whilebeluga_amclcontinues to provide some level of service.
Multithreaded Beluga vs. Nav2 AMCL with Likelihood Field Sensor Model
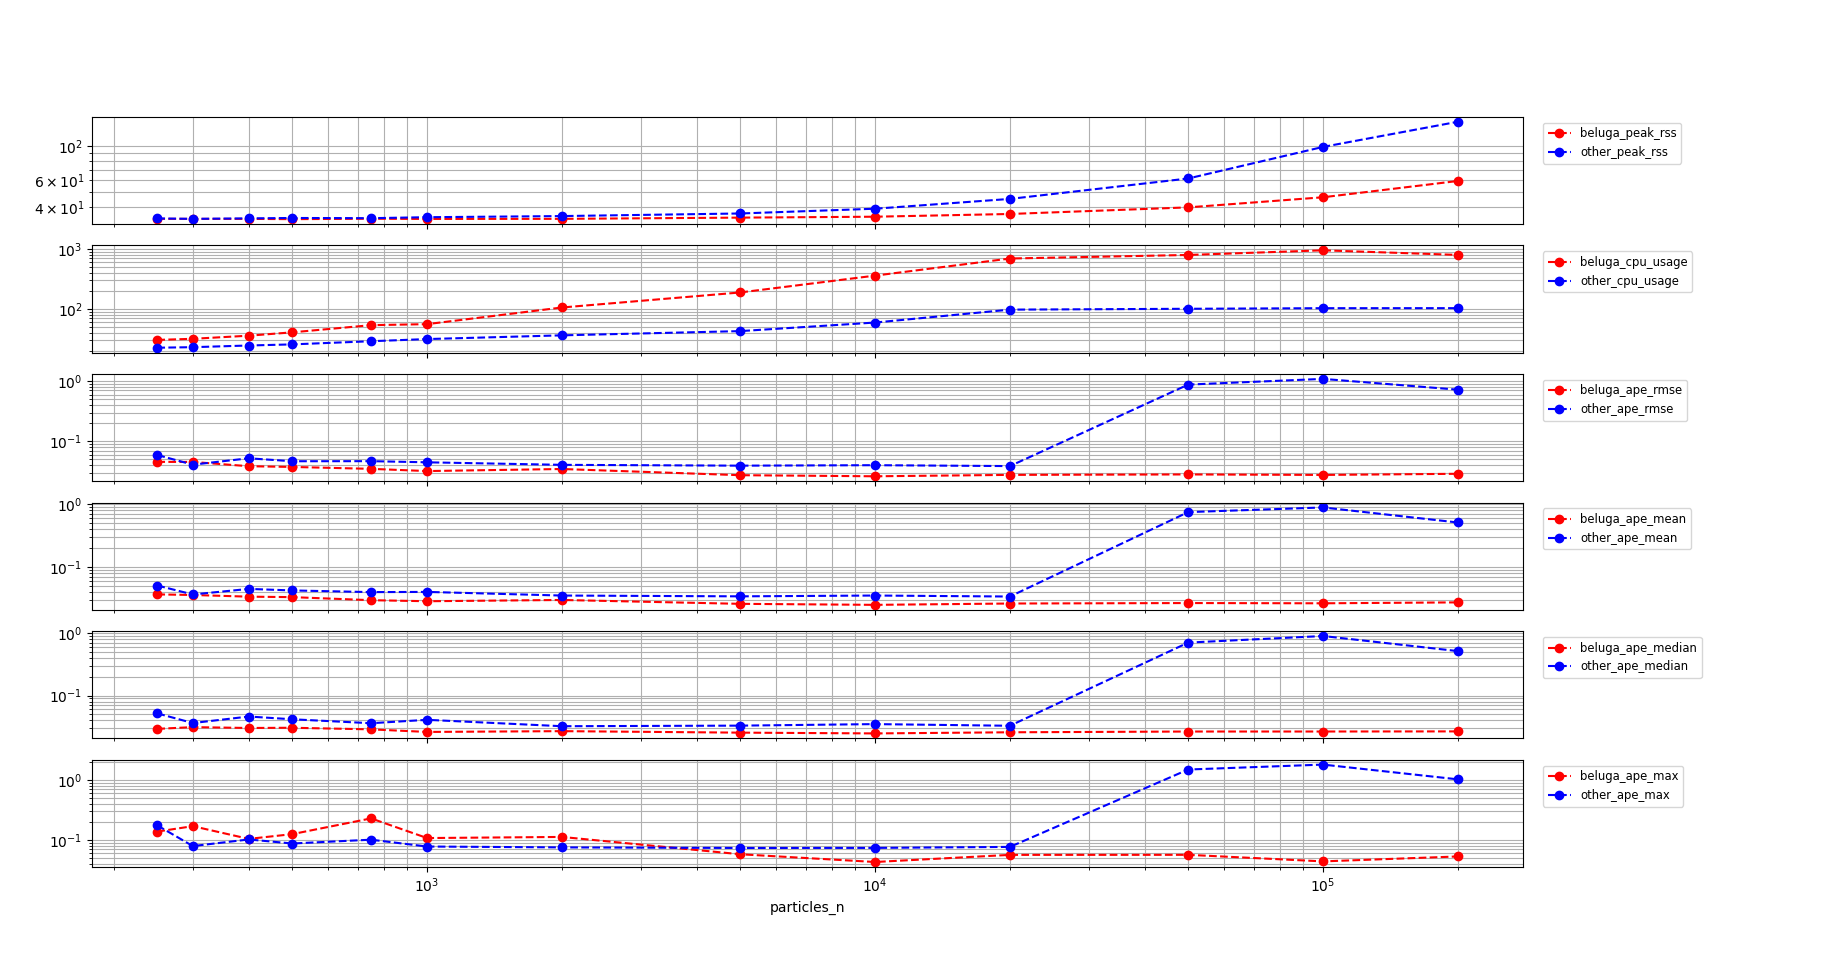
Commentary on the results:
Memory usage for
beluga_amclgrows slower than fornav2_amclthroughout the whole range of particle counts.beluga_amclprovides consistent APE performance all the way up to $10^5$ particles.However, CPU usage for
beluga_amclis consistently higher than that fornav2_amclthroughout the whole range of particles, even in the region below $2k$ particles.
Non-multithreaded Beluga vs. Nav2 AMCL with Beam Sensor Model
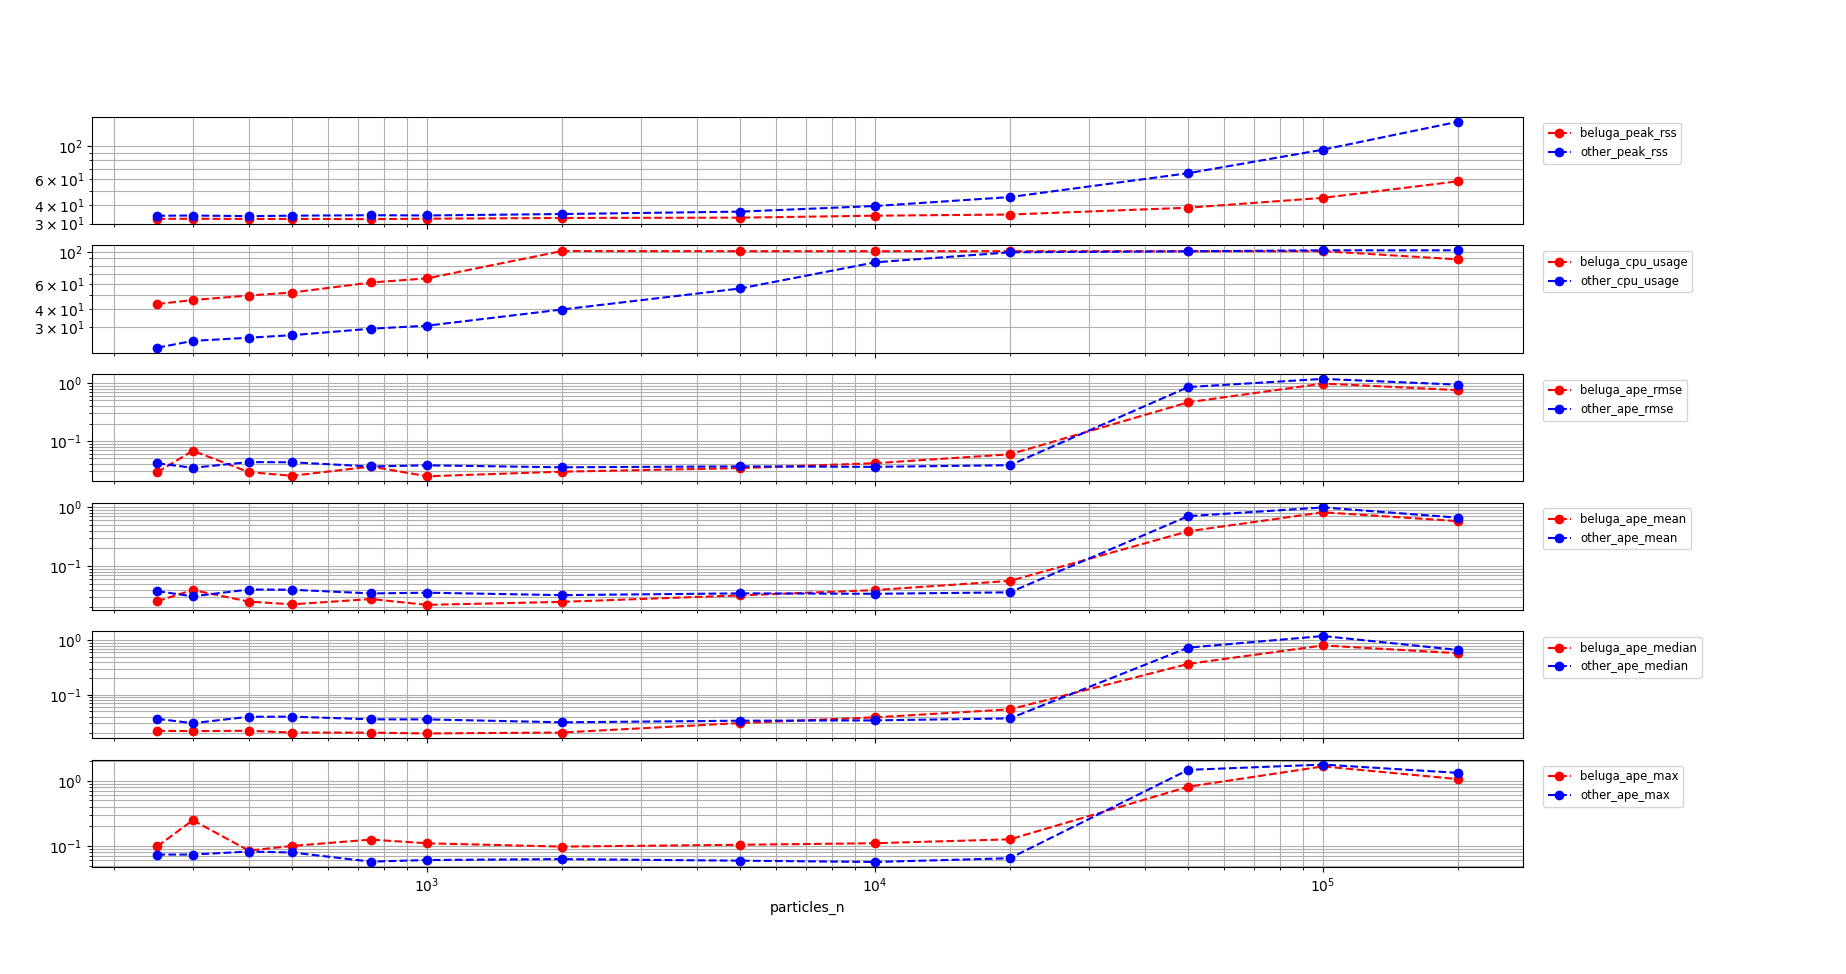
Memory usage for
beluga_amclgrows slower than fornav2_amclthroughout the whole range of particle counts.The recorded CPU usage for
beluga_amclis higher and saturates earlier thannav2_amclwith thebeam sensormodel.The APE is similar for both nodes, with both nodes beginning to degrade deep into the CPU saturation region at around $50k$ particles
Multithreaded Beluga vs. Nav2 AMCL with Beam Sensor Model
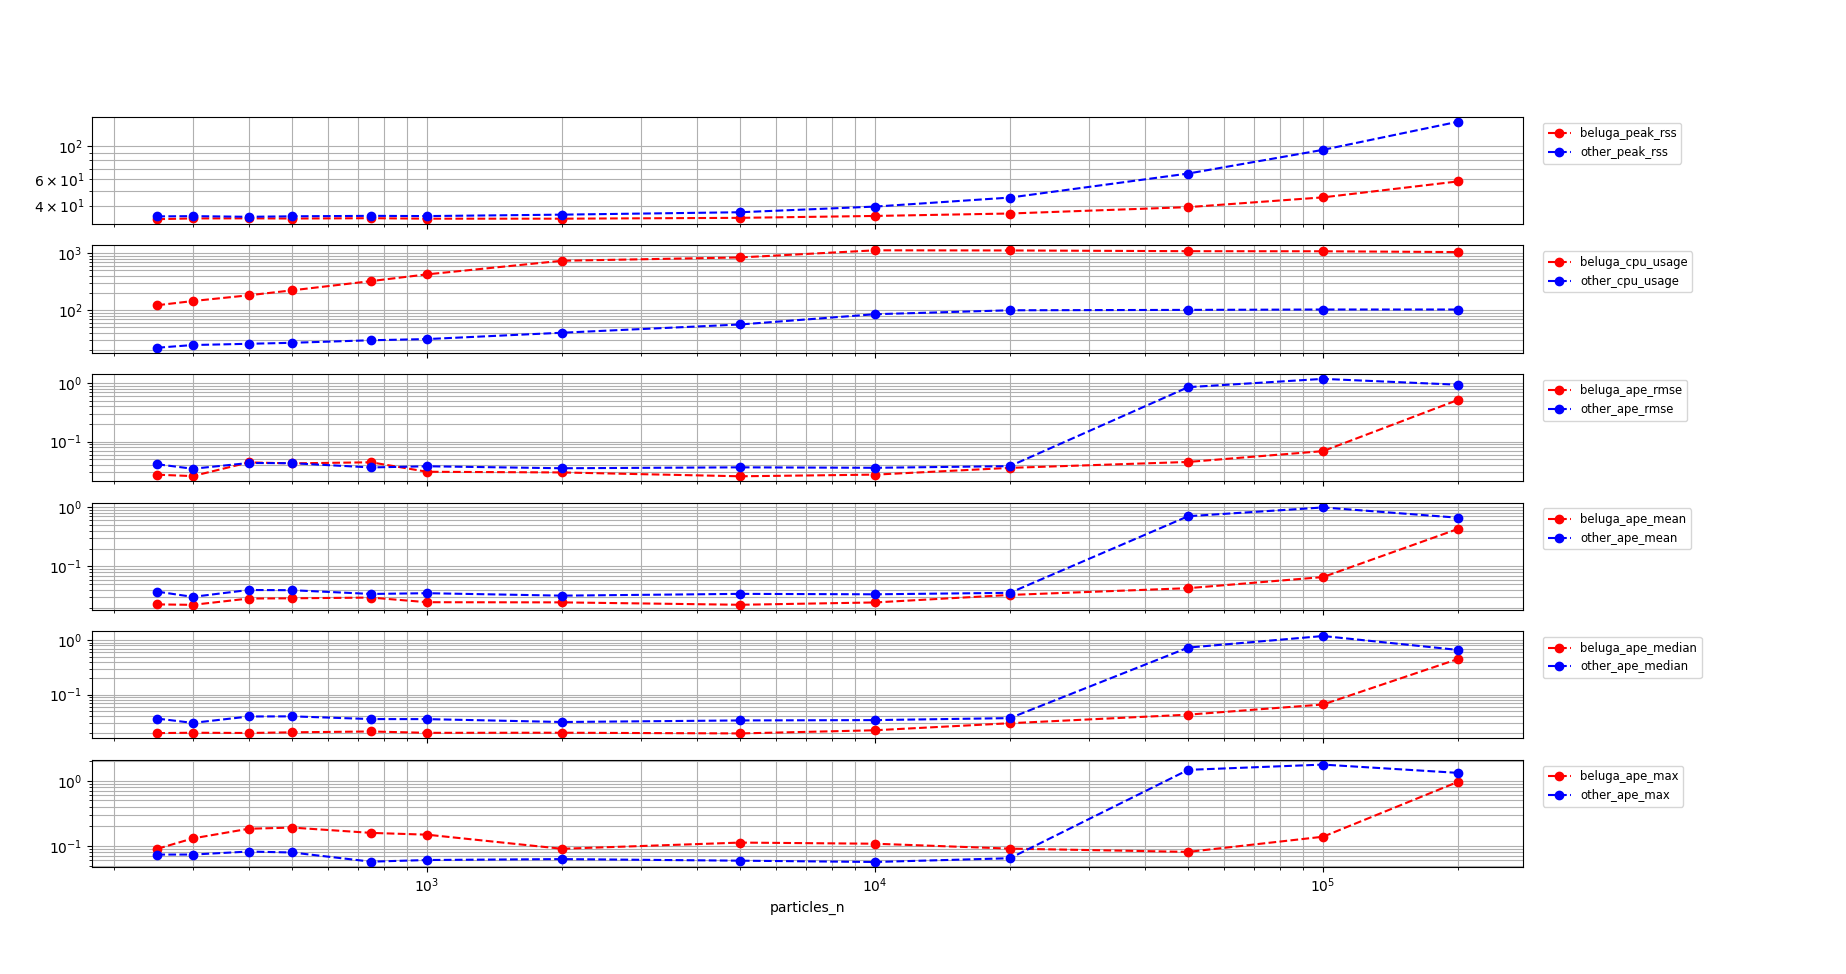
Memory usage for
beluga_amclgrows slower than fornav2_amclthroughout the whole range of particle counts.The recorded CPU usage for
beluga_amclis higher and saturates earlier thannav2_amclwith thebeam sensormodel.The APE is on par for both nodes below $50k$ particles. Beyond this point both nodes degrade, but
nav2_amcldegrades faster suddenly, whilebeluga_amcldegrades more gradually.
Conclusions
beluga_amclprovides better memory usage thannav2_amclin all cases.In all configurations,
beluga_amclprovides similar localization error performance tonav2_amcl, degrading more gradually in the CPU saturation region.CPU usage for
beluga_amclis higher than fornav2_amclboth for:beluga_amclwith thebeam sensormodel.beluga_amclin multithreaded mode.
These experiments do not account for the reduction in iteration latency brought by multithreading. This is a topic for future work.
How to reproduce
To replicate the benchmarks, after building and sourcing the workspace, run the following commands from the current directory:
mkdir beam_beluga_seq
cd beam_beluga_seq
ros2 run beluga_benchmark parameterized_run --initial-pose-y 2.0 250 300 400 500 750 1000 2000 5000 10000 20000 50000 100000 200000  --params-file ../beam_params.yaml
cd -
mkdir beam_beluga_par
cd beam_beluga_par
ros2 run beluga_benchmark parameterized_run --initial-pose-y 2.0 250 300 400 500 750 1000 2000 5000 10000 20000 50000 100000 200000  --params-file ../beam_params_par.yaml
cd -
mkdir beam_nav2_amcl
cd beam_nav2_amcl
ros2 run beluga_benchmark parameterized_run --initial-pose-y 2.0 250 300 400 500 750 1000 2000 5000 10000 20000 50000 100000 200000 --params-file ../beam_params.yaml --package nav2_amcl --executable amcl
cd -
mkdir likelihood_beluga_seq
cd likelihood_beluga_seq
ros2 run beluga_benchmark parameterized_run --initial-pose-y 2.0 250 300 400 500 750 1000 2000 5000 10000 20000 50000 100000 200000  --params-file ../likelihood_params.yaml
cd -
mkdir likelihood_beluga_par
cd likelihood_beluga_par
ros2 run beluga_benchmark parameterized_run --initial-pose-y 2.0 250 300 400 500 750 1000 2000 5000 10000 20000 50000 100000 200000  --params-file ../likelihood_params_par.yaml
cd -
mkdir likelihood_nav2_amcl
cd likelihood_nav2_amcl
ros2 run beluga_benchmark parameterized_run --initial-pose-y 2.0 250 300 400 500 750 1000 2000 5000 10000 20000 50000 100000 200000 --params-file ../likelihood_params.yaml --package nav2_amcl --executable amcl
cd -
Once the data has been acquired, it can be visualized using the following commands:
ros2 run beluga_benchmark compare_results -b beam_beluga_seq/ -o beam_nav2_amcl
ros2 run beluga_benchmark compare_results -b beam_beluga_par/ -o beam_nav2_amcl
ros2 run beluga_benchmark compare_results -b likelihood_beluga_seq/ -o likelihood_nav2_amcl
ros2 run beluga_benchmark compare_results -b likelihood_beluga_par/ -o likelihood_nav2_amcl